Troubled Geographies:
Two centuries of Religious Division in Ireland
|
Troubled Geographies:
|
|
| Home | Summary | Publications | Social Explorer | Acknowledgements | ||||||||||||||||||||||||||||||||||||||||||||||||||||||||||||||||||||||||||||||||||||
Partition and Civil War, 1911-26
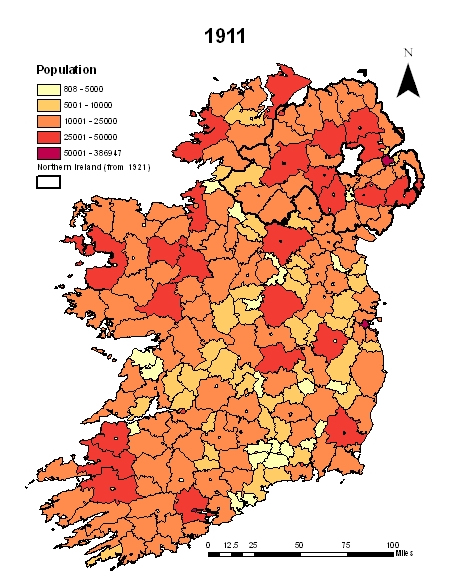
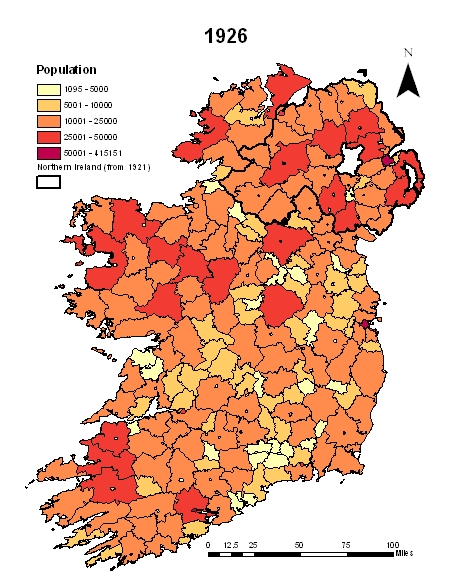
Division, inevitably has emerged as the primary motif of Irish society at the beginning of the twentieth century. But it is not simply the tired old rupture between green and orange; it is rather more nuanced than that, as this chapter will identify. This chapter shall seek to uncover why the old religious centrality of modern Irish history not only held firm in this period, but came to consolidate its position to such an extent that it led directly to the territorial division of the island. a. PopulationThe period between the censuses of 1911 and 1926 was the last in which the population of the island of Ireland as a whole would decline. Thereafter, the population of the island would increase throughout the rest of the first half of the twentieth century. But by 1926 it would be politically divided between the newly-created Northern Ireland and Saorstát Éireann or Irish Free State, and the differing population trajectories of the north and south which had been apparent since the 1891 census, would now be plain for all to see.
The maps above show the total populations at rural and urban district level across the island in 1911 and 1926. There is little discernable difference between the two dates according to these maps and it is only by comparing the populations directly at district level for each date that we can gauge population trends during this period at the local scale.
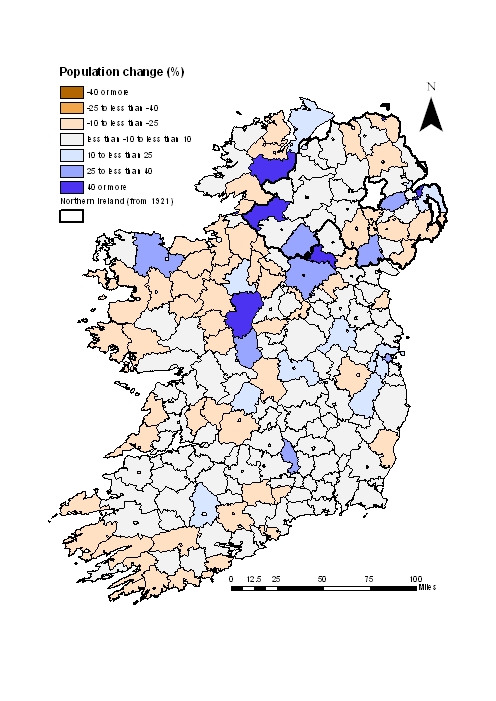
Percentage population change at rural and urban district level between 1911 and 1926 The map above shows that in comparison to the radical falls experienced in earlier periods, fairly broad tracts of the island remained reasonably stable in population terms in the years between 1911 and 1926. The western coastal regions continued to experience population decline, with the largest contiguous area of decline in the north-west, centred on County Sligo. The map reflects the growth of the population around Dublin and Belfast, but other urban centres such as Cork and Limerick have not grown significantly during the period. The map presents a slightly misleading picture as it suggests that there are pockets of substantial rural growth surrounded by decline, for example in County Roscommon in the mid-west of Ireland. This was not the case. Roscommon saw its population drop by over eleven percent in the fifteen year period, from 93,856 to 83,556. The supposed growth is actually the product of districts being aggregated together between the two dates. For example, Roscommon rural district had come to incorporate Strokestown rural district by 1926 and therefore saw a significant percentage rise in the population. Overall the cumulative population of the two separate districts had actually fallen sharply. Such aggregations of units are in themselves a comment on population trends as they typically reflect a fall in the population, whereas the subdivision of administrative spaces usually corresponds to population increase. In every case where the map seems to show an increase in the population in rural districts isolated from the major cities this is actually a product of boundary change reflecting continuing population decline. b. PoliticsIreland changed more during the short period between 1911 and 1926 than at any other time during the past two centuries. This section provides the political context to the social and religious developments which this chapter identifies.
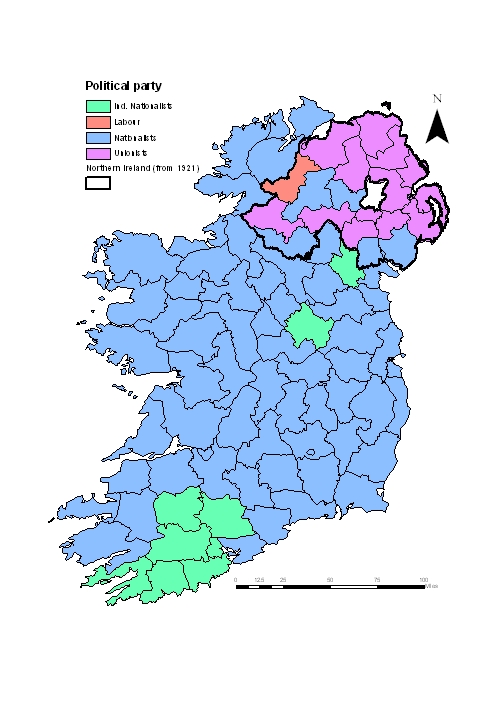
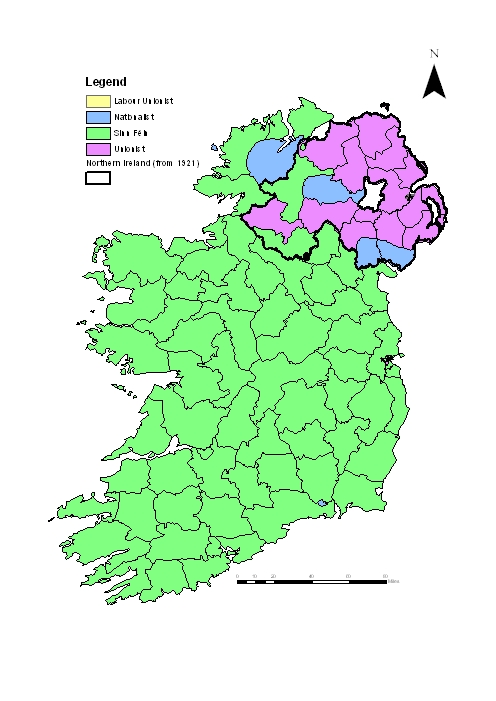
Results of the 1910 Westminster elections. Cork City was a two-seat constituency in 1910, Nationalists won both seats. The maps above shows the results of the 1910 general election, just four years before the outbreak of World War I. The map of electoral results shows that the country was already clearly divided between a nationalist south, which returned candidates supporting Home Rule, and a unionist north, with a dominant political culture sworn to maintaining the link with Britain in its fullest form. The greatest political ironies in this period lie in an examination of the notion of loyalty. For the vast majority of nationalists, agitation for home rule was not a halfway-house to full independence; there was little appetite for that. For nationalists, it was merely the recognition that Ireland be allowed to take its rightful place alongside the other member nations of the British Commonwealth.
Results of the 1918 Westminster elections. Cork City was a two-seat constituency in 1918, Nationalists won both seats. The Easter Rising of 1916 took most people by surprise, not least much of the British garrison in the city. Nevertheless the republicans who had seized control of the General Post Office and other key buildings in the capital were defeated and rounded up within a matter of days. Initial public reaction to the Rising among the Irish in general was hostile, however, the Rising may have been a strategic failure but the ill-judged British response made it a symbolic victory of huge proportions. The execution of fifteen of the ringleaders, including Connolly and Patrick Pearse over the period of ten days marked the start of a change in public opinion towards the Rising. During the years after the Rising the more militant Sinn Féin completely supplanted the home rule party as nationalist aspirations moved from limited self-determination to full independence. This is nowhere clearer than in the election results for 1918, shown above, which show that Sinn Féin won every seat in the twenty-six county area apart from the constituency of Rathmines in Dublin’s affluent Anglo-Irish Southside.
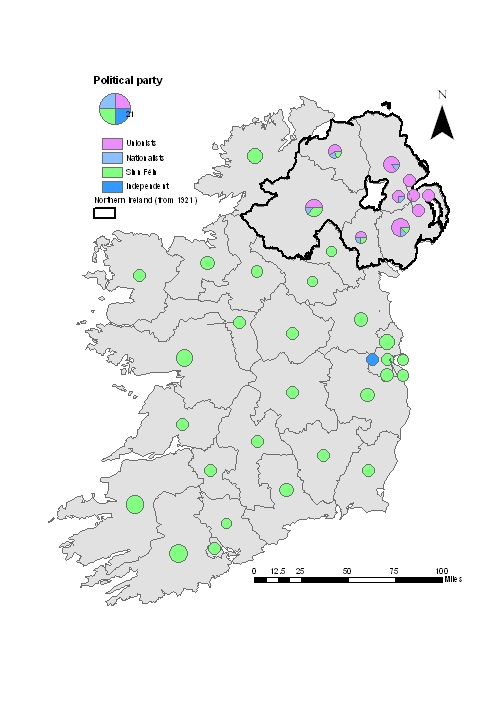
Results of the 1921 Northern Ireland and Southern Ireland elections. Circle size is proportional to the number of seats. In 1919 hostilities between the Irish Republican Army (I.R.A.) and British forces escalated and during the next year 192 policemen and 150 soldiers were killed by the republicans. The British responded not only militarily but legislatively by the introduction of the Government of Ireland Act which brought Home Rule into force with separate parliaments in both Belfast and Dublin, although the development was ignored by Sínn Féin, who by now had their own shadow administrative and legal structures in place and were operating as the de facto government of Ireland. The conflict progressed with increasing bitterness as regular British troops were reinforced by the ill-disciplined ‘Black and Tans’ until a truce was finally called in July 1921. Protracted negotiations led to the signing of the Anglo-Irish Treaty in December. The Treaty split nationalist Ireland but not primarily because it conceded the exclusion of the six counties of Northern Ireland, but because of the oath of allegiance to the British monarch and the failure to deliver a full Irish Republic. The treaty was ratified by the Dáil and had the clear support of the majority of people in the twenty-six counties, although opposition was particularly strong in the south-west of the country as indicated in figure 6.7. This was the area which would see the most intense fighting of the Civil War and some of its worst atrocities such as the Ballyseedy massacre in which nine anti-Treaty ‘die hards’ were tied to a landmine which was then detonated in an example of the sort of summary justice not uncommon during the period.
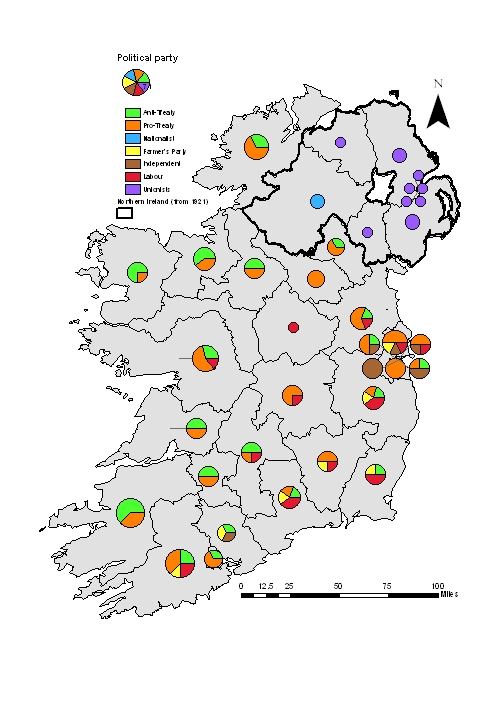
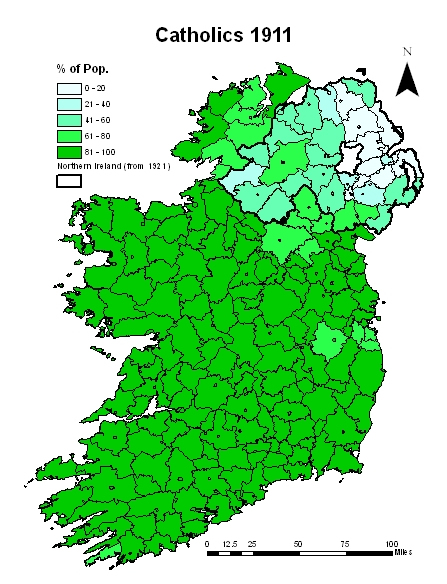
Results of the 1922 Northern Ireland and Saorstát Éireann elections. c. Religion
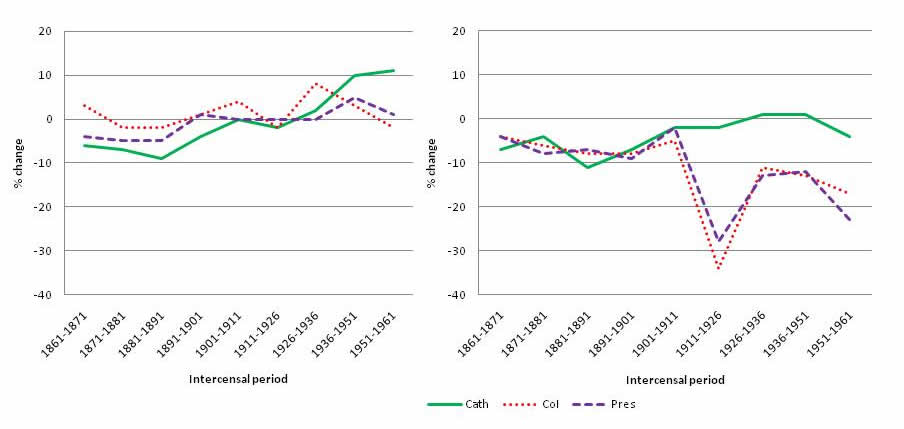
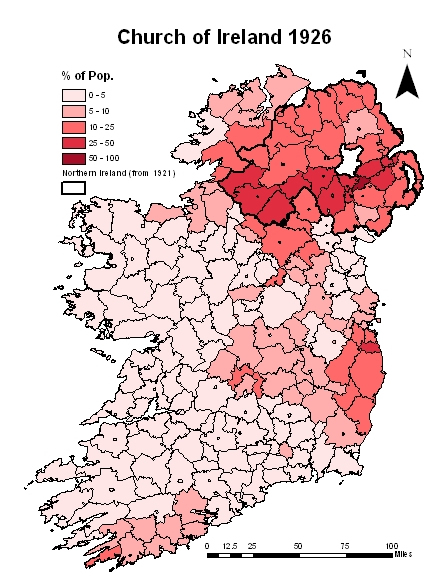
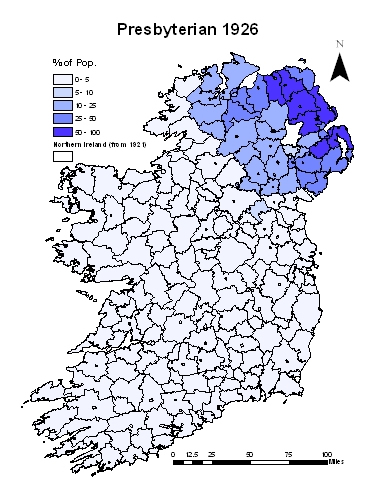
Intercensal percentage change in three major religions in between 1861 and 1961 in (a) the Northern Ireland area (left-hand side) and (b) the Republic of Ireland area (right-hand side). In the period prior to 1911 Ireland’s three main religions broadly display similar demographic patters. For example, the left-hand figure above shows percentage change in the religions in the Northern Ireland area across the century from 1861, we can see that each of the groups experienced population decline after the Famine, with Catholics faring slightly worse and taking longer to recover from its effects. This observation ties in with the last chapter’s observations on the disproportionately severe impact of the Famine in Catholic areas of Ulster. The right-hand figure shows the same information for the Republic of Ireland area over the same period, it is a similar pattern of decline among Catholics, Presbyterians and members of the Church of Ireland prior to 1911. However, between 1911 and 1926 the situation changed dramatically as the two major Protestant denominations both experienced massive levels of decline in the twenty-six county area. During this time the Church of Ireland population fell by nearly thirty-five percent while the number of Presbyterians collapsed by twenty-seven percent.
|
||||||||||||||||||||||||||||||||||||||||||||||||||||||||||||||||||||||||||||||||||||||||
|
|
|
|
|